Melting Ice Experiment
Physical sciences 2-ps1-4.
Construct an argument with evidence that some changes caused by heating or cooling can be reversed and some cannot.

Physical Sciences 5-PS1-1
Develop a model to describe that matter is made of particles too small to be seen.
Physical Sciences MS-PS1-4
Develop a model that predicts and describes changes in particle motion, temperature, and state of a pure substance when thermal energy is added or removed.
Physical Sciences HS-PS3-4
Plan and conduct an investigation to provide evidence that the transfer of thermal energy when two components of different temperature are combined within a closed system results in a more uniform energy distribution among the components in the system (second law of thermodynamics).

In this activity, students will predict, observe, and compare melt rates of ice under different temperature conditions and in different solutions.
- Cool and warm water
- Ice cubes (4-6 per group, uniform size and shape)
- Food coloring
- Thermometers
- Colander, mesh strainer, or other similar device
- Small bowls (2 per group)
- Cloth or paper towels
- (Optional) pitchers for pouring water
- (Optional) basin for catching poured water
- (Optional) funnels
- This activity requires flowing water. If available, a faucet with cold and warm water can be used. Otherwise, use pitchers with warm and cold water. However, note that the rate at which water is poured from a pitcher can vary greatly. Pouring through a funnel can help regulate the flow of water.
- Consider having towels on hand for cleaning up spills and splashes.
- Safety: Hot water can scald. Make sure students are using water that is below 110° F (43° C).
- Use the leftover water from this activity to water a plant or save it for another activity instead of dumping it down the drain.
The Greenland ice sheet is the second largest body of ice in the world right behind the Antarctic ice sheet. As the ice sheet melts, the water flows into the ocean, contributing to global sea level rise.
As glacier ice melts, some of the water can reach the ground below the ice, forming a river that channels glacier water into the ocean. As it flows into the ocean, this cold, fresh meltwater will rise above the warmer, salty ocean water because freshwater is less dense than salt water.
The rising cold water then draws in the warmer ocean water, melting the face of the glacier from the bottom up. This creates an overhang of ice, the edges of which will eventually break off in a process called calving, which quickly adds more ice to the ocean. As ocean waters warm, this calving process speeds up.
This narrated animation shows warm ocean water is melting glaciers from below, causing their edges to break off in a process called calving. Credit: NASA | Watch on YouTube
Understanding these different factors that contribute to Greenland's melting ice sheet is an important part of improving estimates of sea level rise. The Oceans Melting Greenland (OMG) mission was designed to help scientists do just that using a combination of water temperature probes, precise glacier elevation measurements, airborne marine gravity, and ship-based observations of the sea floor geometry. The mission, which ran from 2016 to 2022, provided a data set that scientists can now use to model ocean/ice interactions and improve estimates of global sea level rise.
Part 1: Still Water
Introduce or ask students what they know about glaciers, ice melt, and sea level rise. Consider using the lesson What’s Causing Sea-Level Rise? and having students read 10 Interesting Things About Glaciers from NASA's Climate Kids website prior to this activity. If necessary, remind students that glaciers are huge, long-lasting masses of ice sitting on landmasses that form over many years. Snow accumulates and compresses into glacier ice under the weight of newer layers of snowfall above. Glaciers are not to be confused with icebergs, which are large chunks of glaciers or ice sheets that have broken off and float freely in the ocean.
Tell students they are going to compare how quickly ice melts under different conditions. Ask students to predict what will happen to the ice and water temperature under the following conditions. Predictions can be relative (e.g., “Ice will melt faster in condition A”) or specific (e.g., “Ice will melt in X seconds in condition A”).
- Ice cube placed in a dish of room temperature water
- Ice cube placed in a dish of hot water
- Ice cube placed under flowing room temperature water
- Ice cube placed under flowing hot water

Fill one container with room-temperature water and a second container with hot water. Image credit: NASA/JPL-Caltech
As a class demonstration, or in groups of two to four students:
- Fill one dish with room temperature water.
- Measure and record the temperature.
- Gently place an ice cube in the dish and record how long it takes for the ice cube to melt. There should be enough water in the dish so the ice cube floats.
- Measure and record the water temperature after the ice has melted.

Place an ice cube in each container of water and time how long it takes the ice to melt. Image credit: NASA/JPL-Caltech
Repeat the procedure using hot water. These two steps can be done at the same time if students are able to monitor and record the melt time for both cubes of ice.
Ask students to share their results and observations.
Part 2: Flowing Water
Under a faucet of running water, or using water from a pitcher (see Management tip about using a funnel), complete the following as a demonstration or in groups of two to four students:
- Run the faucet and adjust as needed to get the water at the same room temperature as in the previous step. Record the temperature.

mage credit: NASA/JPL-Caltech
- Place an ice cube in a colander or mesh strainer and run it under the faucet, or pour water from the pitcher onto the ice cube. Record how long it takes to melt.

Image credit: NASA/JPL-Caltech
Repeat the procedure using hot water, matching the temperature from the earlier step.

Part 3: Salt and Freshwater
Mix water with food coloring and freeze into ice cubes (two per group or two as a class demo).
Tell students they are going to add a colored ice cube to a saltwater solution and to a freshwater solution and allow the ice to fully melt. Ask them to make predictions about what will happen.
In a clear beaker or plastic container, add 1 teaspoon of salt to 1 cup of water and stir until the salt is dissolved. Allow time for any water movement to stop.
Pour the same amount of freshwater into a clear beaker or plastic container. Allow time for any water movement to stop.
Gently add one ice cube to each container, taking care to not disturb the water too much.
Have students observe each container and take notes. It may be helpful for students to place a white sheet of paper behind the containers to see more details.
When the ice has melted, ask students to compare their observations to their predictions and develop hypotheses about the phenomena they observed.
Some food coloring in the container with the salty solution will mix with the salt water, but the majority of the coloring will be concentrated in the freshwater layer at the top. The top layer should be noticeably darker.

The cup on the left (with blue food coloring) contained ice melted in a saltwater solution while the one on the right (with the red food coloring) contained ice melted in a freshwater solution. Image credit: NASA/JPL-Caltech
If necessary, explain to students that because one container has salt water, and one has freshwater, the less dense meltwater floats on salt water but has the same density and mixes with the freshwater.
Connect this phenomenon to the movement of fresh meltwater from under a glacier into warm ocean water.
- Which ice cube melted fastest? Which melted slowest? How could these results be altered? Changing the flow rate and temperature of the water will change how quickly the ice melts.
- What do these results tell you about the melting of glaciers in different conditions? Currents of warm ocean water will melt glaciers faster than still water.
- What would happen to cold meltwater that flows out from under a glacier into salty ocean water? The freshwater will rise because of its lower density, drawing in warmer ocean water against the face of the glacier.
- Students should accurately measure and record temperature and melt times.
- High school chemistry students should accurately calculate what the final temperature of the water in the containers will be in Part 1 by using specific heat capacity.
- Ask students to investigate whether ice exposed to warm or room temperature air would melt more quickly or more slowly than ice exposed to still or flowing warm or room temperature water.
- Lower elementary: Ask students to predict what would happen if some of the water was removed from the containers in Part 1 and placed in the freezer. Freeze some of the water to confirm their predictions.
- Upper elementary: Remove some of the salt water from Part 3 and place it on a flat, non-porous surface to dry. Ask students to predict what will happen when the water evaporates. Repeat the process with freshwater. Allow water to dry overnight and compare predictions to observations of what occurred.
- Middle school: Ask students to draw or describe the changes in particle motion, temperature, and state(s) of matter at the beginning and end of their observations.
- High school: Using the known masses and temperatures of the ice cubes and water in Part 1, have students calculate the final temperature of the water in the room temperature bowl and the hot water bowl using the formula m 1 CΔT 1 = m 2 CΔT 2 . Then, have them compare their calculations to observed results.
About the Author

Lyle Tavernier
Educational Technology Specialist, NASA-JPL Education Office
Lesson Last Updated: Nov. 4, 2024
GCSEPhysicsNinja.com
Smarter teaching – smarter learning.

49. Melting ice – a heating graph

Melting Ice - Graph of Temperature vs Time
GCSE Physics Keywords: Melting, Temperature, Energy, Bonds, Breaking, Vapourisation
Course overview
Privacy Overview
Get Your ALL ACCESS Shop Pass here →


What Makes Ice Melt Faster?
What makes ice melt faster? Let’s investigate with simple ice melting experiments that kids of varying ages can enjoy. Learn about lowered freezing points, freezing depression points, and more! We love simple science experiments for kids!
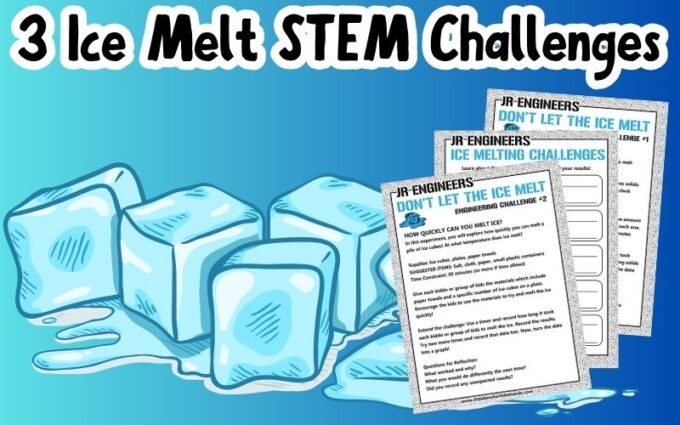
Free Printable Ice Melting Experiment Worksheets!
Let’s get right to learning all about ice. Head to the kitchen, open the freezer and be prepared to experiment with these different ice projects.
Grade Level: Suitable for Kindergarten through 3rd Grade
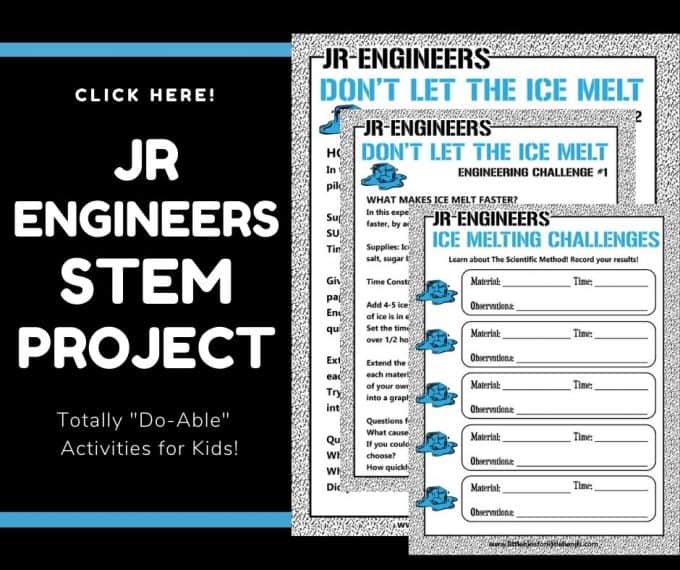
Project #1: What Makes Ice Melt Faster?
In this experiment, you will investigate what makes ice melt faster, by adding several different solids to your ice. Make sure to use the scientific method and pick variables for this project.
💡 Make ice cream in a bag and homemade slushies to explore the concepts further.
Supplies Needed:
- Muffin tin, jars, or containers
- Various solids. You can start with table salt and sugar, but also include different types of salt, baking soda, sand or dirt etc.
- Stopwatch or clock to determine the time of the experiment

Experiment Set Up:
STEP 1: Add 4 to 5 ice cubes to 6 cupcake cups. Make sure the same amount of ice is in each one.
STEP 2: Add 3 tablespoons of each solid to a separate container of ice.
- Add 3 tablespoons of baking soda to cup #1.
- Add 3 tablespoons of salt to cup #2.
- Add 3 tablespoons of sand to cup #3.
Cup #4, cup #5 and cup #6 are your controls and will have nothing added to the ice.
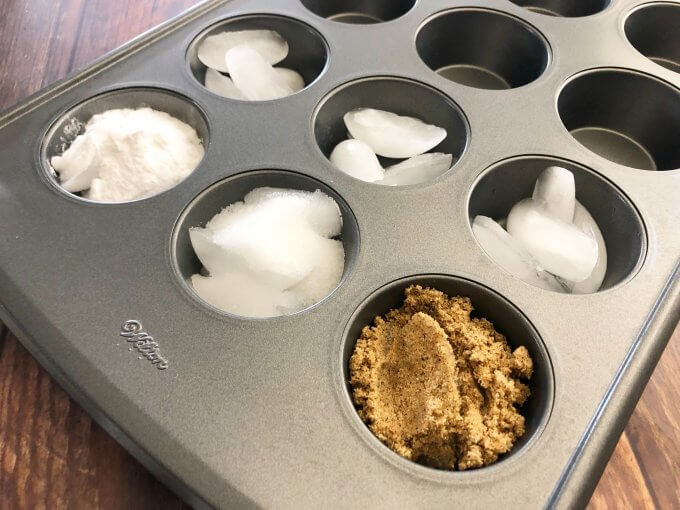
STEP 3: Set the timer to check back on the ice cubes every 10 minutes over 1/2 hour and record your results. Then draw your conclusions.
What did you find caused the ice to melt fastest?
EXTENSION: Use a timer to record how long each material took to melt the ice. Record the results. Try adding solids of your own choice and record that data, too. Now, turn the data into a graph!
Science Explanation: Why Does Salt Melt Ice?
Unsurprisingly, adding salt (sodium chloride or NaCl) made the ice melt fastest. Baking soda was second as it’s a type of salt and can lower the freezing point of water. However, it is a powder. Sand did not do much! So why does salt melt ice?
Salt lowers water’s freezing or melting point. It interferes with ice crystals, and by mixing with the liquid water on the melting ice, it speeds up the melting process. This is also called a lowered freezing point.
💡 Read more about the Freezing Point Depression further below.
Project #2: How Quickly Can Ice Melt?
In this experiment, you will explore how quickly you can melt a pile of ice cubes! At what temperature does ice melt? Read on to learn more!
The challenge is to see how quickly you can melt the ice cubes. This can be done individually or in small groups. If you choose to use the small group format, make sure to allow a few minutes for the kids to brainstorm ideas together.
- Paper towels
- Optional: Table Salt (sodium chloride, NaCl), Cloth, Paper, Small Plastic Food Containers
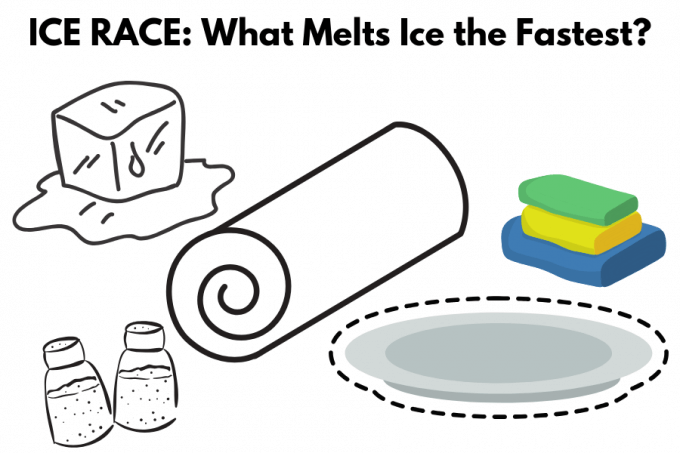
STEP 1: Give each kiddo or group of kids the materials, including paper towels and a specific number of ice cubes on a plate.
STEP 2: Encourage the kids to use the materials to try and melt the ice quickly!
STEP 3: When the race is over (set a specific amount of time that works for you), ask groups to share the steps of their melting process. Discuss what worked and why. Also, discuss what you would do differently the next time!
💡 Use a timer and record how long it took each kiddo or group of kids to melt the ice. Record the results. Try two more times and record that data. Now, turn the data into a graph!
The Science: Freezing Point Depression
Freezing point depression explains why adding something to a liquid, like salt to water, can cause it to freeze at a lower temperature than it usually would (lowered freezing point).
Here’s an example to help you understand: Think about plain water. It freezes and turns into ice at 32°F (0°C). But if you add salt (sodium chloride) to the water, the freezing point drops. The water now has to be even colder than 32°F to freeze! This is why salt is often spread on icy roads in winter – it helps melt the ice by lowering the water’s freezing point.
💡 The salt and water, when mixed, become a chemical solution !
In simple terms, adding certain substances (like salt) to a liquid makes it harder for that liquid to freeze! Ice at the freezing point of water has less energy or heat than water at the same temperature!
💡 Learn more about the freezing point of water with our freezing water experiment .
More Ways to Melt Ice Cubes
There are many possible ways to melt ice. The simplest way is just to leave the ice to melt at room temperature. The heat energy in the warmer room works to break up the ice structure to turn it to water. We see this all the time with the ice cubes in our drink glasses or if we accidentally leave one out on the counter.
You could hold the ice cube in your hand (brrr, chilly) to speed up the melting process since your body is usually warmer than the room. To make it melt even faster this way, try rubbing your hands together really fast before holding the ice cube. Rubbing your hands together quickly creates friction, which adds more heat through an increased temperature!
Another way to generate more heat and a higher temperature is to rub the ice cube on a piece of cloth.
How about placing the ice cube on a dark piece of cloth or paper and placing it in sunlight? Dark colors retain heat from sunlight better than light colors, so you might feel hotter wearing a dark T-shirt in the middle of a hot summer day!
💡 See our what colors absorb heat best experiment.
Project #3: How Do You Keep Ice From Melting?
In this third experiment, you will investigate how to keep ice from melting. Instead of seeing how fast ice melts, let’s try to keep it cool instead!
The challenge is to see how slowly you can keep the ice from melting by reducing the amount of heat or energy that surrounds the ice. This can also be done individually or in small groups. Remember, if you do choose to use the small group format, make sure to allow for time for the kids to brainstorm ideas together.
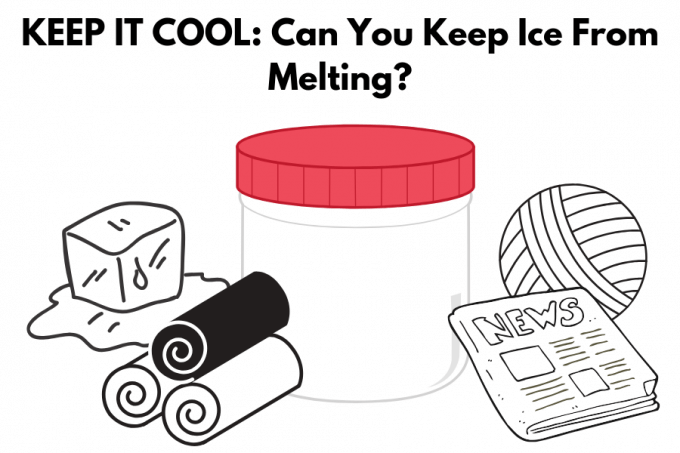
- Small zip-top bags
- Small plastic containers (as close to the same size as possible so they are uniform)
- Various materials (eg Aluminum foil, cotton balls, paper towels, rubber bands)
💡 There are quite a few items that can be potentially used for this ice cube insulation challenge! Check out the recycling bin, junk drawer, garage, and more. This is also where our dollar store engineering kit comes in handy. You can use the items you have available for a budget-friendly STEM challenge.
STEP 1: Brainstorm. What are the best materials available to keep the ice from melting?
STEP 2: Decide what materials or combination of materials you want to use to keep your ice cubes from melting by insulating them! Create one or more insulated containers to test your ideas. You can choose a specific amount of time for this portion of the project or split the STEM challenge up over several days.
STEP 3: When all the insulated containers are finished, place an ice cube in a small zip-top plastic bag and then place it in the insulated container. Make sure to put the lids on!
💡 As a control , you will want to place a zip-top bag, with an ice cube into it, in a similar container that is not insulated. This control container is for comparison. By creating a control, you make it possible to determine whether the materials (variables) you chose are responsible for the outcome!
STEP 4: Place all the containers in a cool dry place away from a heat source or direct sunlight. No extra energy is needed here!
STEP 5: Check your containers every 10 minutes. Notice any differences Record your observations until all of the ice is completely melted. Make sure you do not handle the ice or remove the ice from the container while you make your observations.
STEP 6: Think about what materials worked best and why. How can you improve your results?
Science Explanation: How Insulation Works
Everyone knows that when you remove ice from the freezer, it will melt over time. However, most of us don’t think about why it happens. The air around the ice cubes is usually warmer than the ice and it causes the ice (solid) to change into water (liquid). States of matter too!
So, if you do not want the ice to melt, you need to keep the warm air (heat energy) away from the ice by using an insulating material. Some great insulators just for a hint are felt, newspaper, and wool. Insulation prevents the transfer of heat to the ice so the ice crystals stay icy and cold longer.
Insulation is also used to keep our houses warm in the winter in cold parts of the world by keeping the cold out! Additionally, insulation can keep the heat out of a house on a hot day too! Insulation can keep up comfortably when the temperature drops and when it rises!
💡 Learn more about insulation with this insulation experiment !
Printable Science Projects For Kids
If you’re looking to grab all of our printable science projects in one convenient place plus exclusive worksheets and bonuses like a STEAM Project pack, our Science Project Pack is what you need! Over 300+ Pages!
- Bonus Quick Grab Packs for Biology, Earth Science, Chemistry, and Physics
- 90+ classic science activities with journal pages, supply lists, set up and process, and science information. NEW! Activity-specific observation pages!
- Best science practices posters and our original science method process folders for extra alternatives!
- Be a Collector activities pack introduces kids to the world of making collections through the eyes of a scientist. What will they collect first?
- Know the Words Science vocabulary pack includes flashcards, crosswords, and word searches that illuminate keywords in the experiments!
- My science journal writing prompts explore what it means to be a scientist!
- Bonus STEAM Project Pack: Art meets science with doable projects!
- Pingback: 40+ Creative & Easy Ways to Play with Ice - HAPPY TODDLER PLAYTIME
I love your stuff! but why is it so wordy….taakes a lot of ink to print out even the simple stuff….just give list of ingredients……about 15 great ideas but didn’t print out one becasuse they were all 8 to 12 pages long
HI, an article like this is not meant to be printed which is why it’s not helpful to you. Our shop offers paid packs for download though.
Comments are closed.

Subscribe to receive a free 5-Day STEM Challenge Guide
~ projects to try now ~.

IMAGES
VIDEO